

Looking for a Shorter Overview?
AI Summary
Key Moments
Definition and Impact of Detractors
Detractors are customers who score 0-6 on NPS and subtract directly from your Net Promoter Score.Proper Segmentation of Detractors
Segment detractors by issue, recency, value, and behavior before deciding action.Structured Follow-Up Process
A scheduled six-step routine improves engagement with detractors and addresses root causes.Use of Review Platforms Alongside Surveys
Tracking 1-2 star reviews as detractors helps spot themes and complements survey insights.A detractor is any customer who answers 0 to 6 on the 0 to 10 "How likely are you to recommend us?" question, and their share is subtracted from your NPS. If that low score tells you someone won't recommend you today, does it also prove they've complained, left a bad review, or decided to leave?
That's the gap teams often miss. They treat a survey label as a verdict on the customer, then either panic or hide those customers from review and testimonial programs. A better habit is simpler. Read the score as a routing signal, find the reason behind it, and fix what you can verify.
What Is a Detractor and Who Counts as One
A detractor is anyone who answers 0 to 6 to the NPS question "How likely are you to recommend us to a friend or colleague?" on a 0 to 10 scale. That's the whole definition. The label comes from one answer, at one moment, to one question about recommendation.


Imagine lanes at an airport. The survey sorts every respondent into one of three lanes based only on how likely they are to recommend you. It doesn't check their order history, their last support ticket, or whether they've praised you elsewhere.
The three NPS groups at a glance
| Group | Score on the 0 to 10 question | Effect on NPS | Typical recommendation behavior |
|---|---|---|---|
| Detractor | 0 to 6 | Subtracted from the score | Unlikely to recommend, may still renew or stay silent |
| Passive | 7 to 8 | Counted in total responses only | Satisfied but not enthusiastic, rarely recommends |
| Promoter | 9 to 10 | Added to the score | Likely to recommend and repurchase |
Passives sit in the middle for a reason. A 7 or 8 usually means "good enough," not "I'd stake my reputation on you." They count toward your total responses, so they affect the percentages, but they never add to or subtract from the score directly.
Promoters at 9 and 10 are the enthusiastic end. They've cleared a high bar, which is why only those two scores count as a positive term. NPS is deliberately strict at the top and deliberately broad at the bottom.
The boundary is fixed by the scale. A 6 is a detractor even when the written comment sounds mild, and a 7 is a passive even when the comment sounds warm.
That fixed boundary confuses a lot of owners. Say a long time customer gives you a 6 and writes, "Fine overall, delivery was slow once." There's no anger there, yet the math still files them with detractors. The number sets the group, not the tone of the comment.
Use that knowledge today. Open your latest survey export, filter the score column, and count how many responses fall in the 0 to 6 range. Divide that count by your total responses and you've got your detractor share, the single most useful starting number.
One more distinction matters before you act. Some review platforms apply a similar label to 1 to 2 star reviews. That's a separate, review based measure, not the same thing as a survey detractor. You can track both side by side, and the last section shows how teams use them together without mixing them up.
How Detractors Lower Your NPS Score
The formula is short: NPS = % promoters minus % detractors. The Net Promoter System guide to measuring your score states that passives are included in the total number of responses used to calculate percentages, but they do not appear as a separate positive or negative term. The score can range from -100, when every respondent is a detractor, to +100, when every respondent is a promoter. That arithmetic shows how much drag detractors create. It does not explain why anyone scored low.
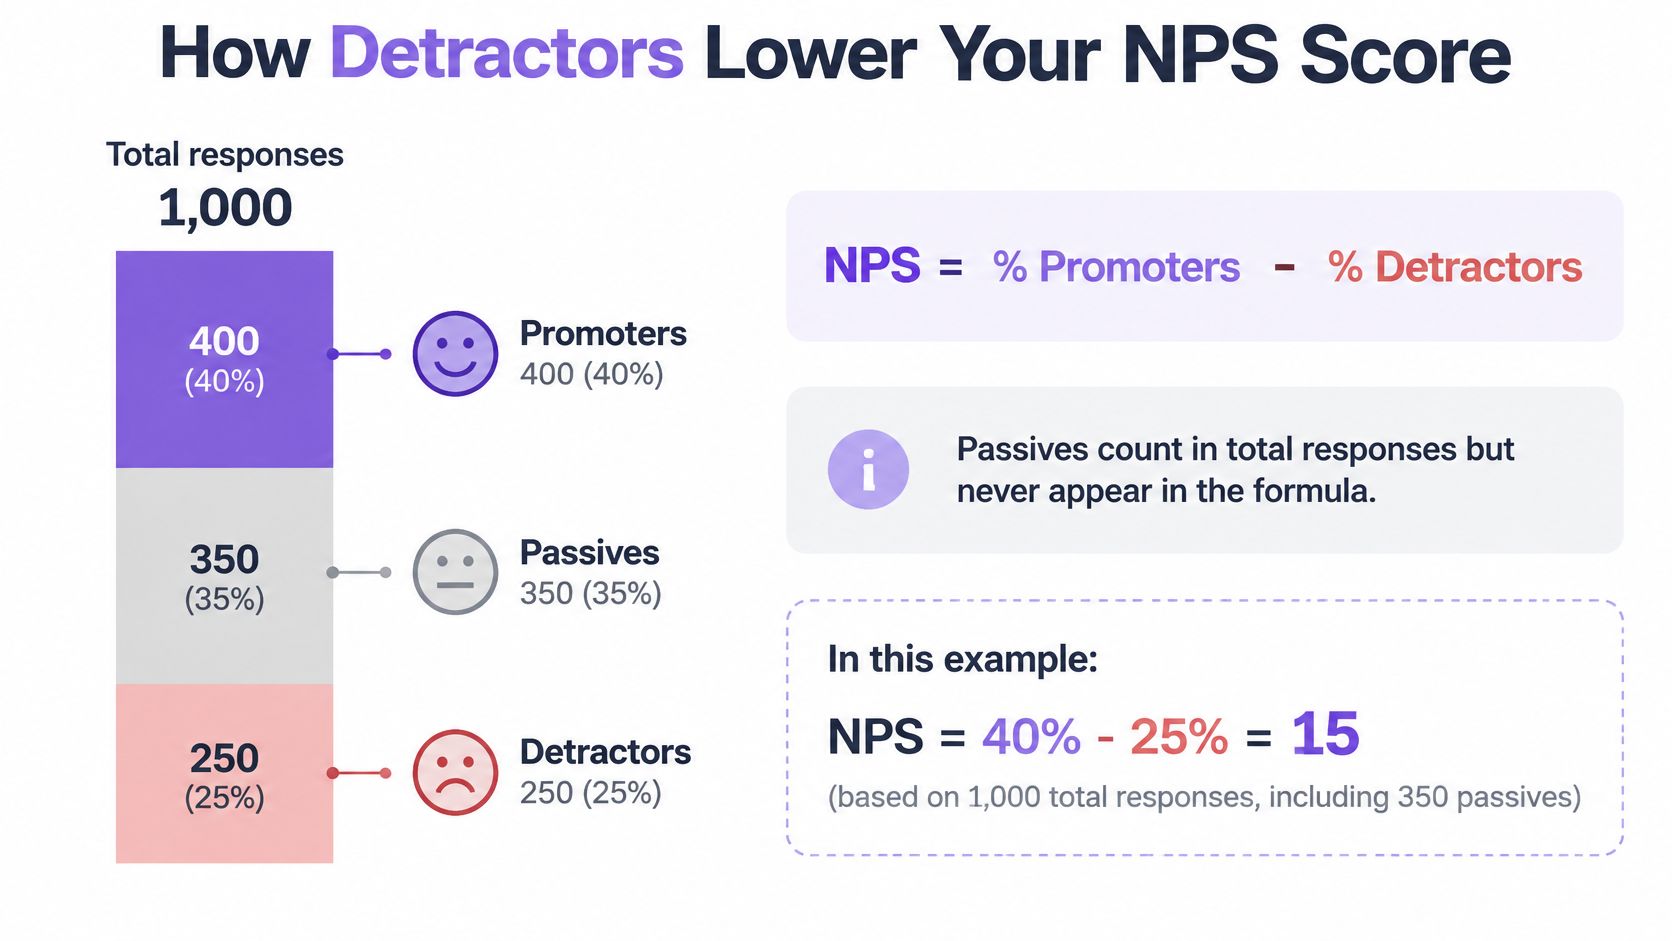
Passives still shape the result, even though they are invisible in the formula. A large passive group dilutes both sides because every percentage is calculated out of total responses. That is why a score near zero can mean a polarized customer base or a mostly lukewarm one. You cannot tell which until you look at the three shares separately, which is also why it helps to know when to use NPS and CES rather than leaning on one number for every question.
Here is the dilution in concrete terms. A 100-person survey with 30 promoters, 60 passives, and 10 detractors gives +20. The same 30 promoters and 10 detractors in a 40-person survey with no passives gives +50. The gap between promoters and detractors is identical, but passives shrink the percentage scale.
Worked examples you can copy
| Promoters (%) | Detractors (%) | NPS |
|---|---|---|
| 35 | 20 | +15 |
| 50 | 10 | +40 |
| 30 | 30 | 0 |
| 20 | 45 | -25 |
The first row is the standard textbook case. With 35% promoters and 20% detractors, you subtract 20 from 35 and get +15. The third row shows the trap. A full survey can still land on 0 when promoters and detractors cancel each other out, so zero does not mean nobody responded. The final row shows what happens when detractors outnumber promoters: 20 minus 45 equals -25.
Run the calculation in order
- Count responses. Tally detractors, passives, and promoters from your export.
- Divide by the total. Each group count divided by total responses gives its share.
- Convert to percentages. Multiply each share by 100.
- Subtract. Promoter percentage minus detractor percentage is your NPS.
If you would rather skip the spreadsheet steps, an online NPS calculator runs the same math from your three group counts. Either way, apply one sanity check before you share the number. Your result must fall between -100 and +100. If it does not, a percentage went wrong somewhere.
Small samples deserve extra caution. In a ten-person survey, a single detractor moves the detractor share by ten points. In a thousand-person survey, that same person barely registers. When response counts are low, report the count alongside the score and resist reacting to swings that one or two unhappy customers can explain.
Why Detractors Matter to Growth and Retention
Why spend money chasing people who just gave you a low score? Because the groups usually behave differently, and the difference shows up in revenue. Promoters tend to stay longer, buy more, and recommend the company to others. Detractors show the opposite pattern. The Bain Net Promoter System numbers page puts the lifetime value gap between detractors and promoters at commonly threefold to eightfold.
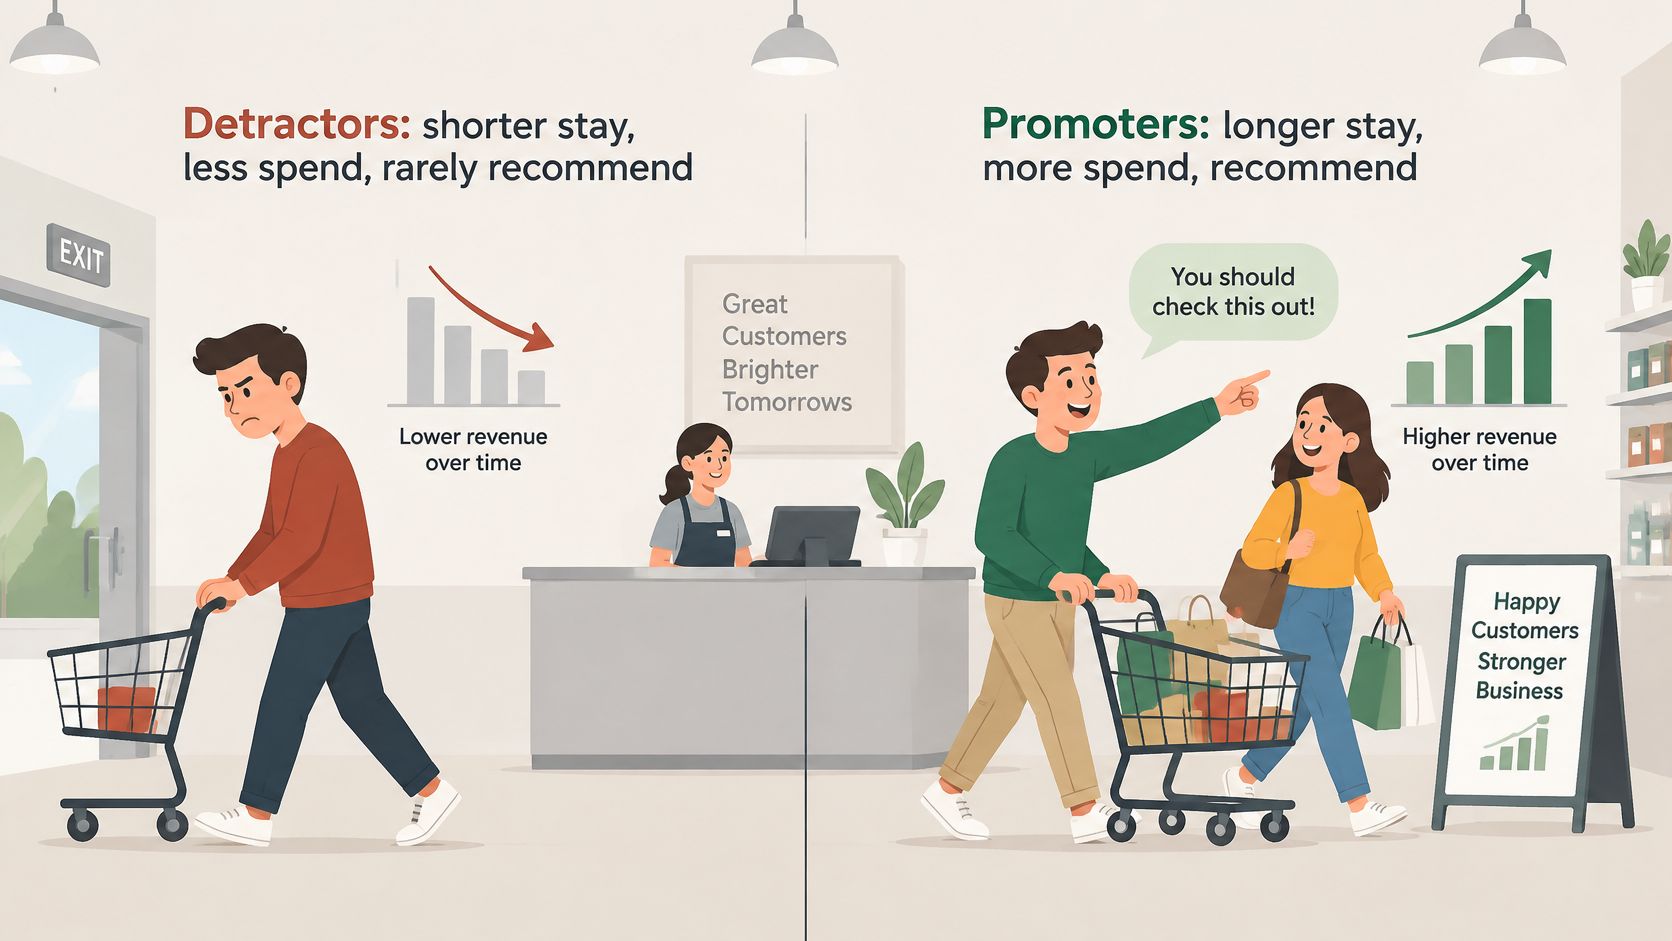
That multiple is the business case for follow-up. If one promoter is worth several detractors over a lifetime, then lifting even a small group up the scale, or removing the friction that pushed them down, protects real revenue. The argument is about the customers in each group, not the label itself.
What the score cannot prove
The link between NPS and growth is contested, though. Peer-reviewed studies use different designs, samples, and definitions, so they reach different conclusions about how reliably a score predicts future revenue. Some question whether the measure gives any guidance on what to fix. Treat a high detractor share as a diagnostic signal to investigate, not as a forecast of next quarter's revenue.
That limit changes how you spend money. Instead of announcing "our score dropped, growth will follow," you ask which customers scored low, what happened to them, and whether they buy less or cancel more. Teams that track customer satisfaction and recovery ROI alongside the score can answer those questions with their own numbers instead of borrowed benchmarks.
"AI told me detractors are mostly complaining about onboarding. That's specific. That's actionable. That's useful." This kind of comment from marketing teams shows the shift that matters, from a score to a named problem.
Take a SaaS company whose detractor comments keep mentioning confusing setup. The team rewrites the first-week checklist, adds one guided step, and checks the next survey wave to see whether setup complaints shrink in that same segment. The score didn't fix anything. The pattern inside the detractor comments did the work.
Close this out with two questions you can answer from your own records. Which current customers are detractors right now? And what would it cost you if they left without a fix? If neither answer is at hand, that's the first task, before any dashboard redesign.
Detractors Are Not Always Lost Customers
The common myth says every detractor is an angry customer packing their bags. It's a tidy story, and it's often wrong. The label applies to anyone who answers 0 to 6, whether or not they've complained, posted a review, cancelled, or warned anyone away from you.
The question measures recommendation intention. It doesn't record actual behavior. A customer can feel lukewarm about recommending you while still renewing, still ordering, and still paying on time.
A 5 that renews every year
Say a customer scores you a 5 because your price feels high. They grumble about cost in the comment box. Then they renew every year and mention your business in local groups when someone asks for exactly what you sell. By the survey's rule they're a detractor. By their behavior they're a steady, if price sensitive, customer.
This isn't a rare exception. Detractors can engage in both positive and negative word of mouth. Someone might say "great product, painful billing" to one friend and recommend you to another whose needs fit better. If you treat every detractor as a brand threat, you'll misclassify those customers and waste recovery effort on people who mainly need one friction point removed.
Segment before you suppress
A better approach sorts detractors before anyone decides what to do with them:
- By issue. Group them by the reason given, such as price, setup, or support.
- By recency. A low score from yesterday outranks one from two quarters ago.
- By customer value. A long standing account deserves a personal call sooner.
- By actual behavior. Check whether they've renewed, bought again, or gone quiet.
Don't automatically remove detractors from testimonial programs either. Some renew, some refer in specific contexts, and some become advocates after a good service recovery. A customer who scored you a 4, got their problem fixed, and now tells that story can be more persuasive than someone who never had a problem at all.
Practical rule: Add "What is the main reason for your score?" to every survey before you decide who to contact, who to suppress, or who to write off.
Without that reason, you're guessing. With it, a low score becomes a diagnosis you can route to the right person. That's the difference between labeling a customer and learning from them.
Examples of Detractor Feedback and What It Signals
Say a boutique hotel owner opens a survey response scored 4 with the comment, "Waited forty minutes at check-in." The number says detractor. The sentence says exactly what broke and where. In most surveys, the comment reveals the reason more reliably than the number does.
Reading comments well is a pattern matching skill. You're not hunting for the angriest wording. You're matching each complaint to the part of your operation that probably produced it, then asking the one question that confirms it.
Five patterns worth tagging
| Feedback pattern | What it usually signals | Follow-up question |
|---|---|---|
| Slow response to a problem | Service or support gap | How long did you wait before getting help? |
| Confusion during setup or first use | Onboarding problem | Which step was hardest to complete? |
| Price complaint without a product issue | Value gap | What would make this worth the price to you? |
| Missing feature or workflow gap | Product gap | Which task were you unable to finish? |
| Low score with no comment | Unknown reason | What is the main reason for your score? |
Slow replies point to a service gap because the customer's complaint is about waiting, not about the product itself. Ask how long they waited and you'll learn whether you have a staffing problem, a routing problem, or one bad day. Setup confusion points somewhere else entirely. When a new customer can't finish step two, your onboarding instructions or first run experience need the fix, not your support scripts.
Price complaints need care. A customer who says "too expensive" but reports no product issue is usually describing a value gap, not a broken feature. They can't yet connect what they pay to what they get. Lowering price won't always help. Showing the outcome, or packaging it more clearly, often does.
Missing features are the most direct product signal. Ask which task they couldn't finish and you'll separate a genuine gap from a feature that exists but nobody can find. Those two problems have very different fixes and very different costs.
The hardest case says nothing
A low score with no comment gives you urgency without direction. You don't know if it's price, service, or a misclick. The reason question is the only way to learn, so send it short and specific rather than a long satisfaction form. If you're sorting large volumes of comments, a review sentiment analyser can help you group the wording before you read closely.
Keep one distinction in mind as you tag. The same comment can arrive with a 6 or a 2. The score sets urgency, the comment sets the fix, and confusing those two leads teams to overreact to tone and underinvest in recurring causes.
Copy a simple three column triage sheet to finish:
- Pattern. Which of the five rows fits this response?
- Owner. One named person, not a team inbox.
- Contact date. The day you'll reach out, written down.
How to Follow Up With Detractors Step by Step
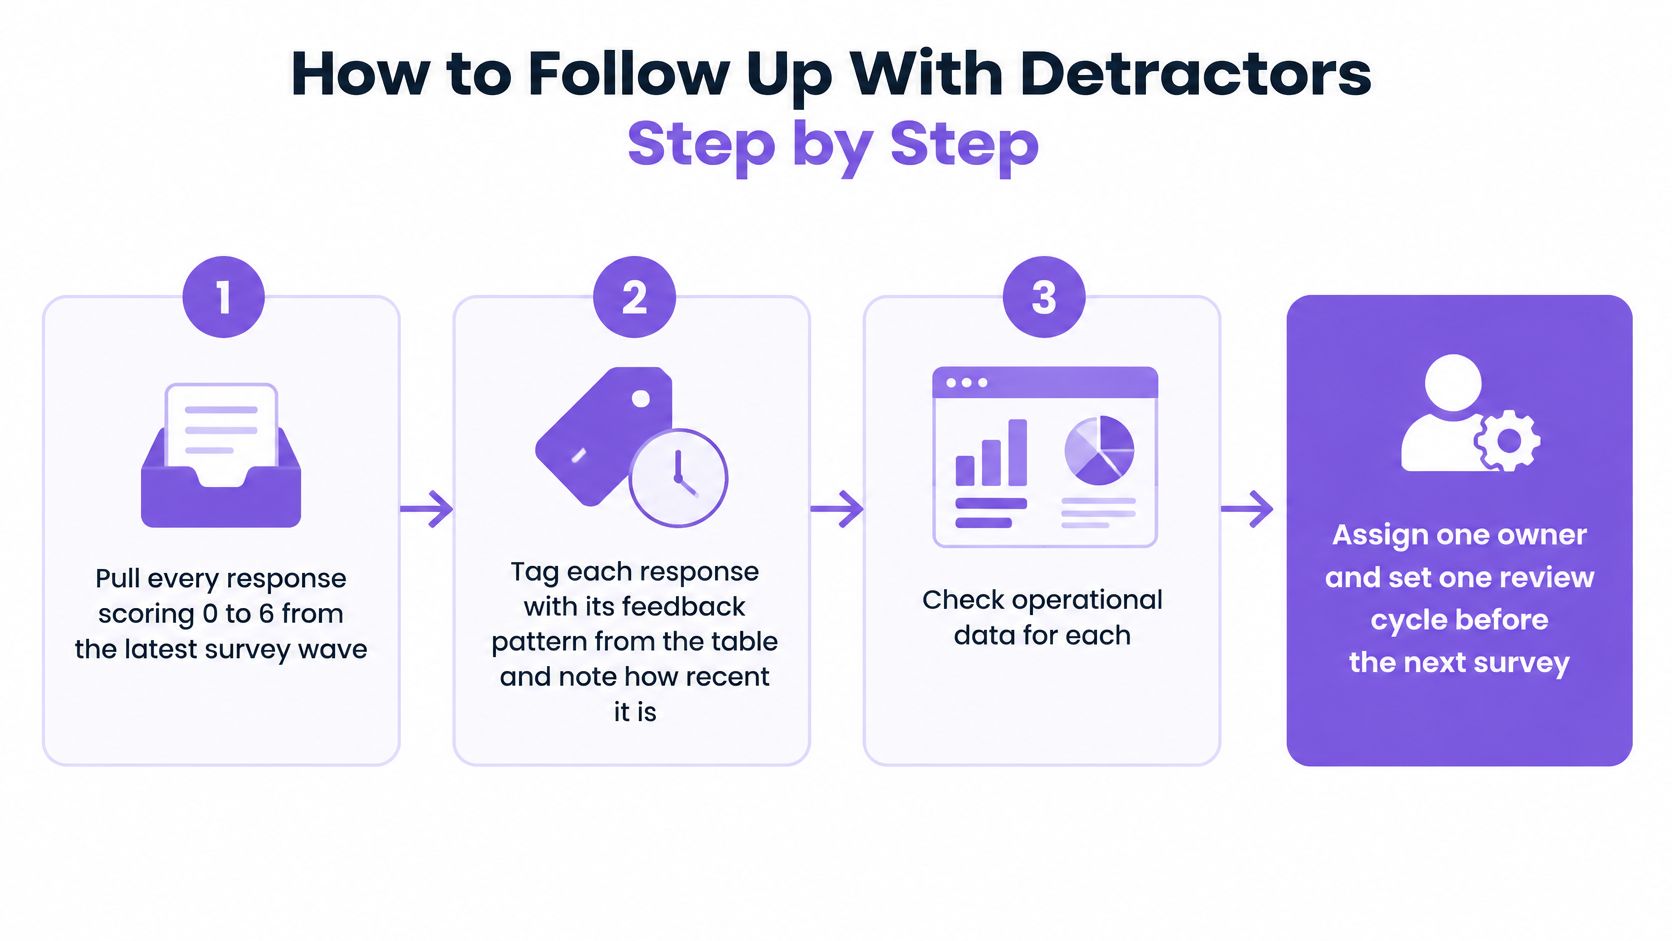
A detractor follow-up works when it runs on a schedule, not as a scramble after a bad score lands in someone's inbox. The order below matters. Check the data before you contact anyone, because a survey answer on its own can push you into the wrong conversation.
Steps 1 to 3 prepare the ground
1. Pull every response scoring 0 to 6 from the latest survey wave. Work from one defined wave so your counts stay clean. Mixing waves makes trend comparisons meaningless later.
2. Tag each response with its feedback pattern and note how recent it is. Use the five patterns from the table above as your tags. Recency decides your contact order, because a problem from this week is usually still fixable.
3. Check operational data for each customer before making contact. Look at support tickets, product usage, cancellations, refunds, and repeat purchases. Compare those records by segment and time period so a small or unrepresentative survey sample does not drive a large decision.
Operational records often change the story. A detractor with rising product usage and a recent repeat purchase needs a different conversation than one who filed three tickets and stopped logging in. The score is identical. The risk isn't.
Remember nonresponse, too. Survey nonresponse can inflate NPS because highly unhappy customers may be less likely to respond. Your detractor list is probably a floor, not a ceiling, which is another reason to compare survey results against cancellations and refunds.
Steps 4 to 6 close the loop
4. Contact each detractor within two working days with the specific follow up question for their pattern. Don't send a generic "sorry you're unhappy" message. Ask the setup detractor which step was hardest. Ask the price detractor what would make it worth the price. Specific questions get usable answers.
5. Fix the root cause, then record what changed and who owns it. A refund or apology may settle one customer, but the recorded fix protects the next fifty. Write down the change, the owner, and the date in the same sheet as your triage columns.
6. Ask the same question in the next survey wave and compare the same segment over time. Changing the question or the audience breaks your comparison. Keep both steady so movement means something. A structured customer feedback management routine helps keep that cadence consistent across waves.
A healthy outcome isn't always a promoter. A detractor who moves to a 7 or higher, or whose issue closes with a recorded fix and a clear owner, counts as progress you can verify.
Notice what this routine refuses to do. It doesn't promise that cutting detractors by some amount will lift revenue by a matching amount. It promises something you can control, which is that every low score gets a reason, an owner, and a follow up date. Treat the score as a recommendation signal, not a verdict on the customer.
Confirm Your Detractor Follow-Up Plan
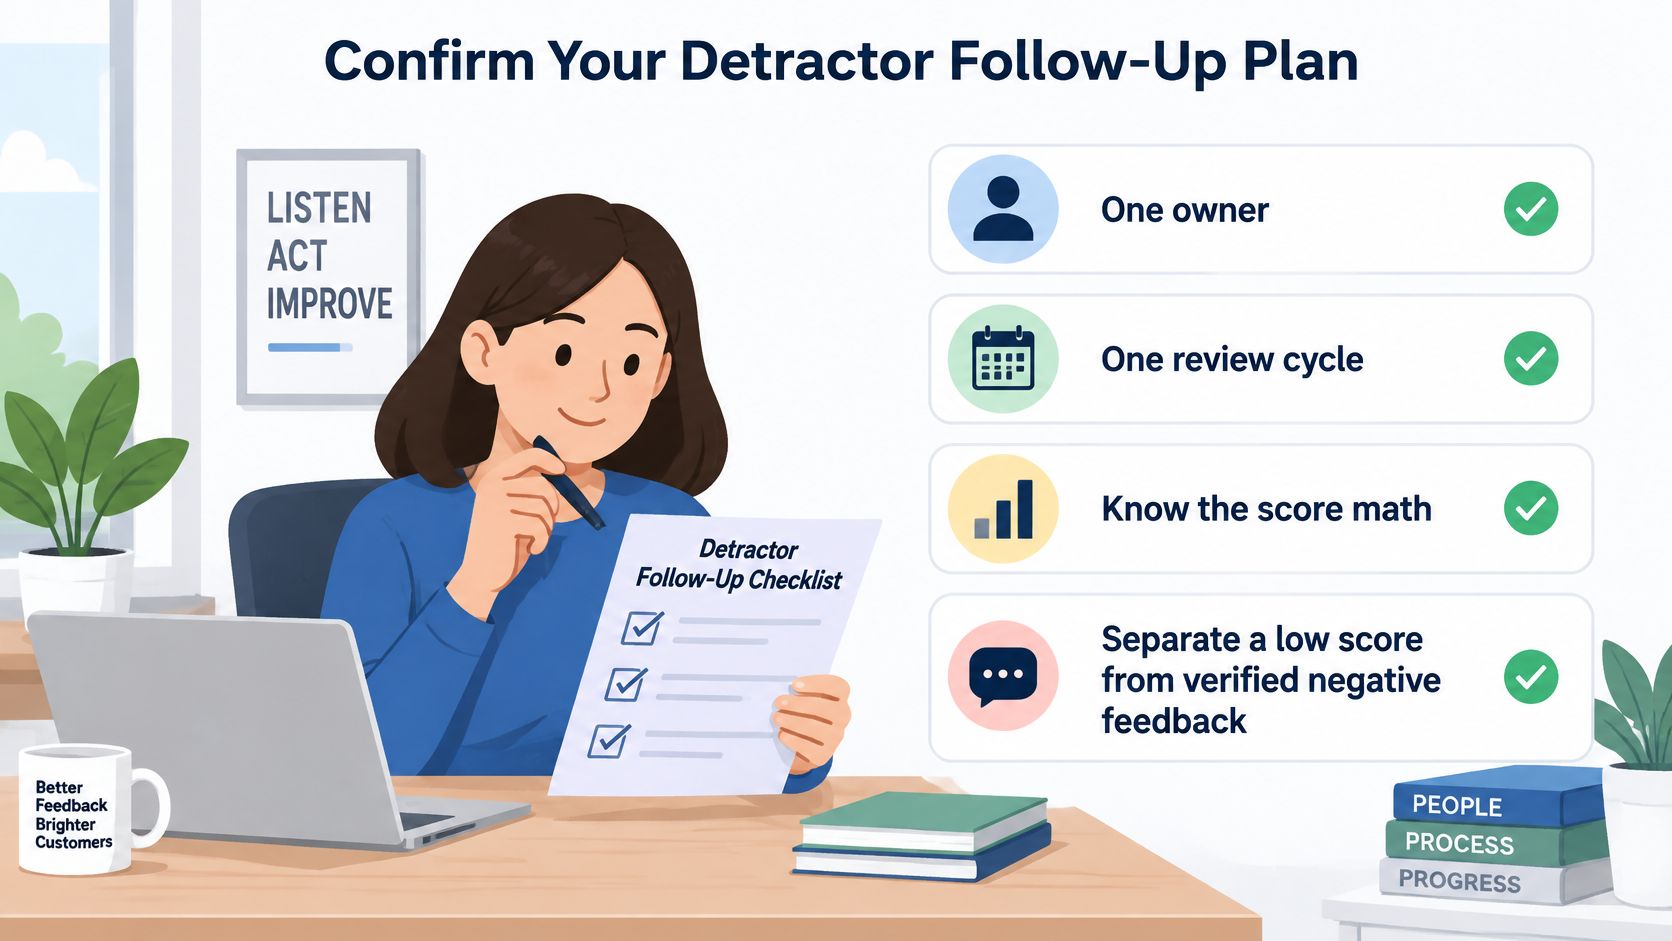
Make the decision now, while it's cheap. Name one owner for detractor follow up and set one review cycle before your next survey goes out. Without those two commitments, the steps above become good intentions that dissolve the first busy week.
Run three checks against your current setup:
- Score math. Can anyone on your team reproduce your NPS from the three group counts?
- Score versus sentiment. Do you separate a low survey score from verified negative sentiment before acting?
- Diagnosis before decisions. Does every detractor route to diagnosis before anyone decides on testimonials or suppression?
If any check fails, fix that one first. They're ordered by dependency, since clean math comes before interpretation, and interpretation comes before action.
Where review data fits in
Review platforms give you a second, always on signal between survey waves. We calculate NPS from reviews by grouping ratings as promoters at 4 to 5 stars, passives at 3 stars, and detractors at 1 to 2 stars, then subtracting the percentage of detractors from the percentage of promoters. That produces a review based NPS you can track alongside your survey score, as long as you never merge the two into one number.
The review side also speeds up pattern spotting. Negative review insights scan 1 and 2 star reviews, summarize recurring themes, and give recommendations to fix the root causes. Instead of reading every complaint one by one, your owner starts from the themes that repeat.
Use this sequence to connect both signals:
- Connect your review sources so ratings arrive in one place.
- Pull recurring themes from 1 and 2 star reviews.
- Match each theme to a feedback pattern from your survey triage.
- Assign one owner per theme with a review date.
Book that date before you close this page. Sit down with your detractor themes, compare them against the previous quarter, and check whether last quarter's recorded fixes shrank the patterns they were meant to fix. If a theme survived a fix, the fix missed the root cause, and that's useful to know.
Ready to put this routine on rails? Bragly pulls your reviews into one place, groups ratings into promoters, passives, and detractors, and surfaces recurring themes from 1 and 2 star reviews so your owner always knows what to fix next. Visit Bragly to connect your review sources and start your first detractor review cycle today.