
Looking for a Shorter Overview?
AI Summary
Key Moments
Start With Decision Context
Begin survey reports by stating the research objective to tie data directly to business or policy decisions.Disclose Methodology and Metrics
Report participant details, response rates, exclusions, weighting, and analysis type to ensure credibility and transparency.Visualize Data Clearly
Choose the right charts and labeling to simplify interpretation and highlight key comparisons.Tailor Reports to Audiences
Provide detailed data for internal users and distilled narratives with methodology notes for external audiences to maintain trust.You've been handed a spreadsheet full of survey responses, cross-tabs, percentages, and open-text comments. A stakeholder wants “the key takeaway” before the next meeting, but the file doesn't explain who answered, who didn't, how incomplete responses were handled, or whether the apparent differences are meaningful. That isn't a reporting problem alone. It's a credibility problem.
Professional reports on surveys turn raw answers into decisions by showing how the data was collected, what it can support, and where uncertainty remains. The strongest reports don't hide technical detail. They translate it so a product manager, executive, or marketer can understand the limits without needing to become a statistician.
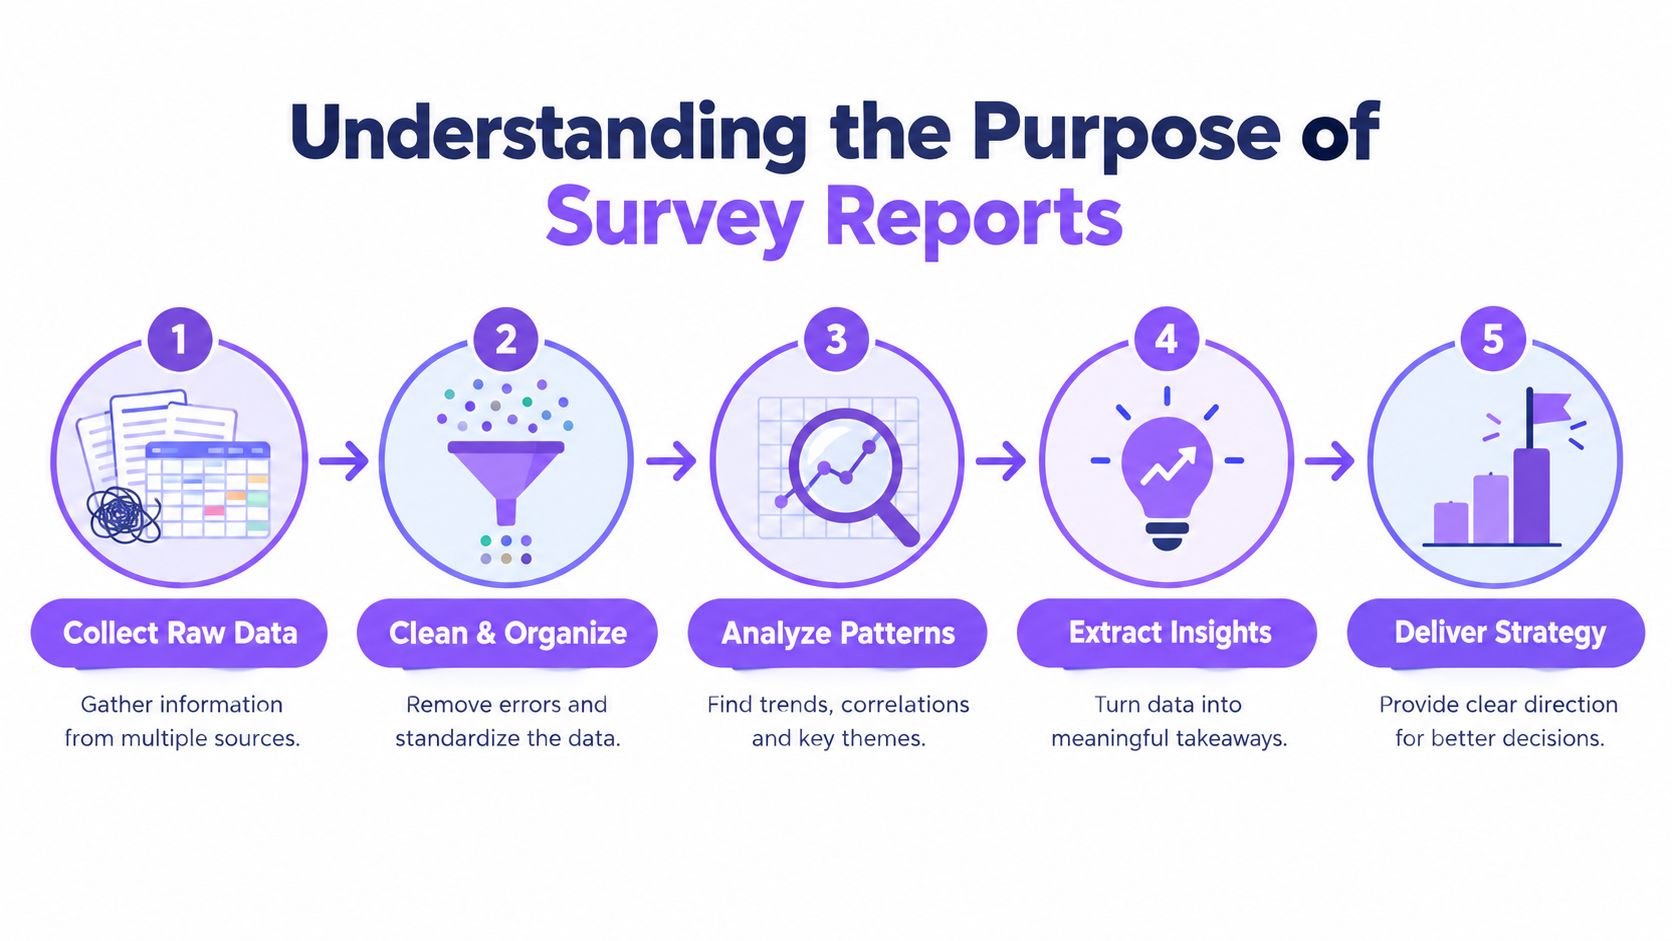
Understanding the Purpose of Survey Reports
A useful survey report starts with a decision, not a chart. Suppose a product team receives feedback suggesting that customers struggle with onboarding. A spreadsheet might show response counts by question, while a report connects those answers to the research objective, explains the respondent group, identifies meaningful patterns, and states what the team should test next. Without that chain, even accurate figures can encourage the wrong action.


Survey research became a formal scientific method in the early twentieth century. A.L. Bowley provided a theoretical justification for survey sampling in 1906 and demonstrated its practical use in a Reading survey published in 1912, as documented by Statistics Canada's historical review of survey methodology. Later reviews describe the 1930s as a period when modern methods developed substantially, followed by expansion during World War II and wider establishment by the 1950s. Face-to-face interviewing, statistical inference, and sample design became standard practices rather than optional refinements.
The launch of the journal Survey Methodology in 1975 marked an important institutional milestone, signaling that survey methods had become a specialized discipline. That history explains why modern reports need more than attractive presentation. Structured sampling, measurable error, and reproducible analysis made survey findings more trustworthy than anecdotal polling.
Reports are measurement records
Survey reports now support public policy, healthcare, social research, and commercial decisions. Historical reviews trace census-like activity to antiquity, while the United States conducted its first modern national population census in 1790. The National Health Interview Survey began in 1957, showing how survey programs became part of national health infrastructure, as described in the historical overview in Public Opinion Quarterly.
The format has changed, but the underlying obligation hasn't. A report should let a reader follow the path from question to conclusion. Resources such as user research by Refact can help teams think more carefully about research objectives and method selection before they start interpreting results.
A polished chart can communicate a finding. Only transparent method reporting can justify it.
Structuring a Professional Survey Report
A report becomes easier to trust when readers know where to find each answer. The document should move from decision context to evidence, then from evidence to action. Don't make executives search through an appendix to discover the result, and don't make analysts accept a headline without access to the method behind it.
Start with the decision
The executive summary should answer four questions quickly:
- What was the research objective? State the business or policy decision the survey informs.
- Who responded? Name the respondent group and relevant eligibility criteria.
- What did the survey reveal? Present the most decision-relevant findings, with appropriate caveats.
- What should happen next? Recommend specific actions, owners, or follow-up analysis.
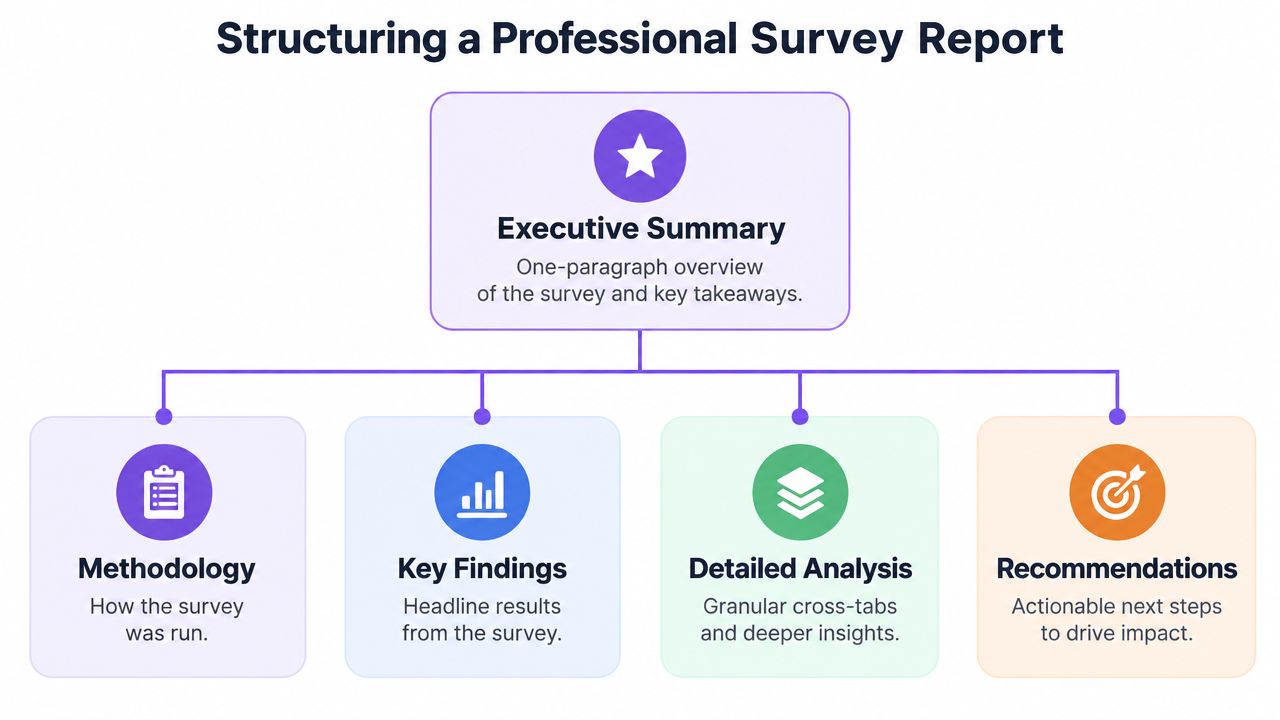
Keep the summary concise, but don't turn it into promotional copy. A strong summary distinguishes observed results from interpretation. “Respondents rated setup as difficult” is a finding. “Simplify setup immediately” is a recommendation. The report should show the reasoning between them.
Use a consistent report anatomy
After the summary, provide the methodology before presenting a long sequence of findings. Readers need to understand the evidence base before they evaluate the conclusions.
- Methodology: Explain the objective, fieldwork, recruitment, questionnaire, sample, exclusions, response calculation, and analysis approach.
- Key findings: Present the few results that answer the central research questions.
- Detailed analysis: Add subgroup comparisons, open-text themes, distributions, and relevant cross-tabs.
- Recommendations: Translate findings into prioritized decisions, not a list of disconnected ideas.
- Appendix: Include the questionnaire, coding rules, detailed tables, weighting notes, and supplementary calculations.
The methodology should state whether the analysis is descriptive or inferential. It should also explain the unit of analysis, such as an individual respondent, household, account, transaction, or organization. Confusing these units can produce apparently precise findings that answer a different question from the one stakeholders asked.
For digital collection, a tool such as Bragly forms may support the collection workflow, but the reporting team still owns the methodological record. The platform used to collect answers doesn't substitute for documenting recruitment, eligibility, missing data, or analysis decisions.
Build a narrative without hiding the detail
Sequence findings by decision importance. Lead with the pattern that changes what the audience should do, then show the supporting breakdowns. Put technical tables in the appendix when they interrupt the main narrative, but link each appendix table to a conclusion in the body.
A report should also preserve version control. Record the fieldwork dates, dataset version, questionnaire version, and any transformations applied before analysis. That small discipline makes later trend comparisons far safer.
Essential Metrics and Statistical Disclosures
Credibility usually fails in the footnotes. Readers need enough information to judge bias risk, uncertainty, and generalizability. Guidance on survey reporting recommends disclosing the objective, respondent group, questionnaires distributed, completed questionnaires or response rate, treatment of incomplete surveys, and unit of analysis. It also calls for the number of potential respondents who couldn't be contacted, reasons questionnaires were excluded, and whether the analysis was descriptive or inferential, as outlined in this survey reporting guidance.
Define the response process precisely
A response rate is the number of respondents divided by the number of eligible subjects in the sample, according to best-practice guidance on survey response reporting. State the denominator you used. “Completed 200 surveys” doesn't tell the reader whether the team invited 250 eligible people or had a much larger unreachable sample.
Report incomplete responses separately from completed responses. Explain whether partial questionnaires were included, which questions were required, and how item-level missingness was handled. A respondent who answered the first page but skipped the outcome question shouldn't just appear in every analysis.
| Disclosure Element | Definition | Why It Matters |
|---|---|---|
| Research objective | The decision or question the survey addresses | Shows whether the instrument matches the intended use |
| Respondent group | Eligible people or organizations included in the target population | Establishes who the findings can describe |
| Invitations and completions | Questionnaires distributed, completed, and partially completed | Makes participation and attrition visible |
| Response rate | Respondents divided by eligible subjects in the sample | Helps readers assess possible nonresponse bias |
| Exclusions | Records removed and the reason for removal | Prevents hidden changes to the achieved sample |
| Unit of analysis | The entity represented by each observation | Protects against incorrect aggregation |
| Analysis type | Descriptive or inferential analysis | Clarifies what conclusions the statistics support |
Explain weighting and design effects
For probability samples, state whether estimates were weighted and how weights were constructed. The American Association for Public Opinion Research standards identify selection probability, eligibility, nonresponse, and post-stratification or calibration as relevant components of weighting documentation.
Weights can correct for unequal selection probabilities, unequal response rates, frame coverage differences, and alignment with population controls, as explained in sample survey guidance from the National Institutes of Health. They can also increase variance. That's why the report should state whether the margin of error was adjusted for weighting, clustering, or other complex-design effects.
A probability-sample report might present a 95% confidence margin of error of plus or minus 1.9 percentage points for full-sample estimates after design-effect adjustment, when that figure applies to the study design and estimate. Don't copy that figure into another report. The principle is the important part: uncertainty must reflect the actual design, not an imaginary simple random sample.
For operational reporting, define release rules for small groups. Oregon guidance generally recommends reporting full-population estimates only when the unweighted denominator is at least 50, the numerator is at least 3, and relative standard error is under 30%. It recommends a warning label for estimates with 30% to under 50% relative standard error and suppression below those thresholds, as specified in Oregon's small-number reporting guidance.
A calculator such as Bragly's NPS calculator can help with a specific score calculation, but the report still needs to disclose the sample, response process, weighting, and uncertainty around the result.
Visualizing Survey Data for Maximum Clarity
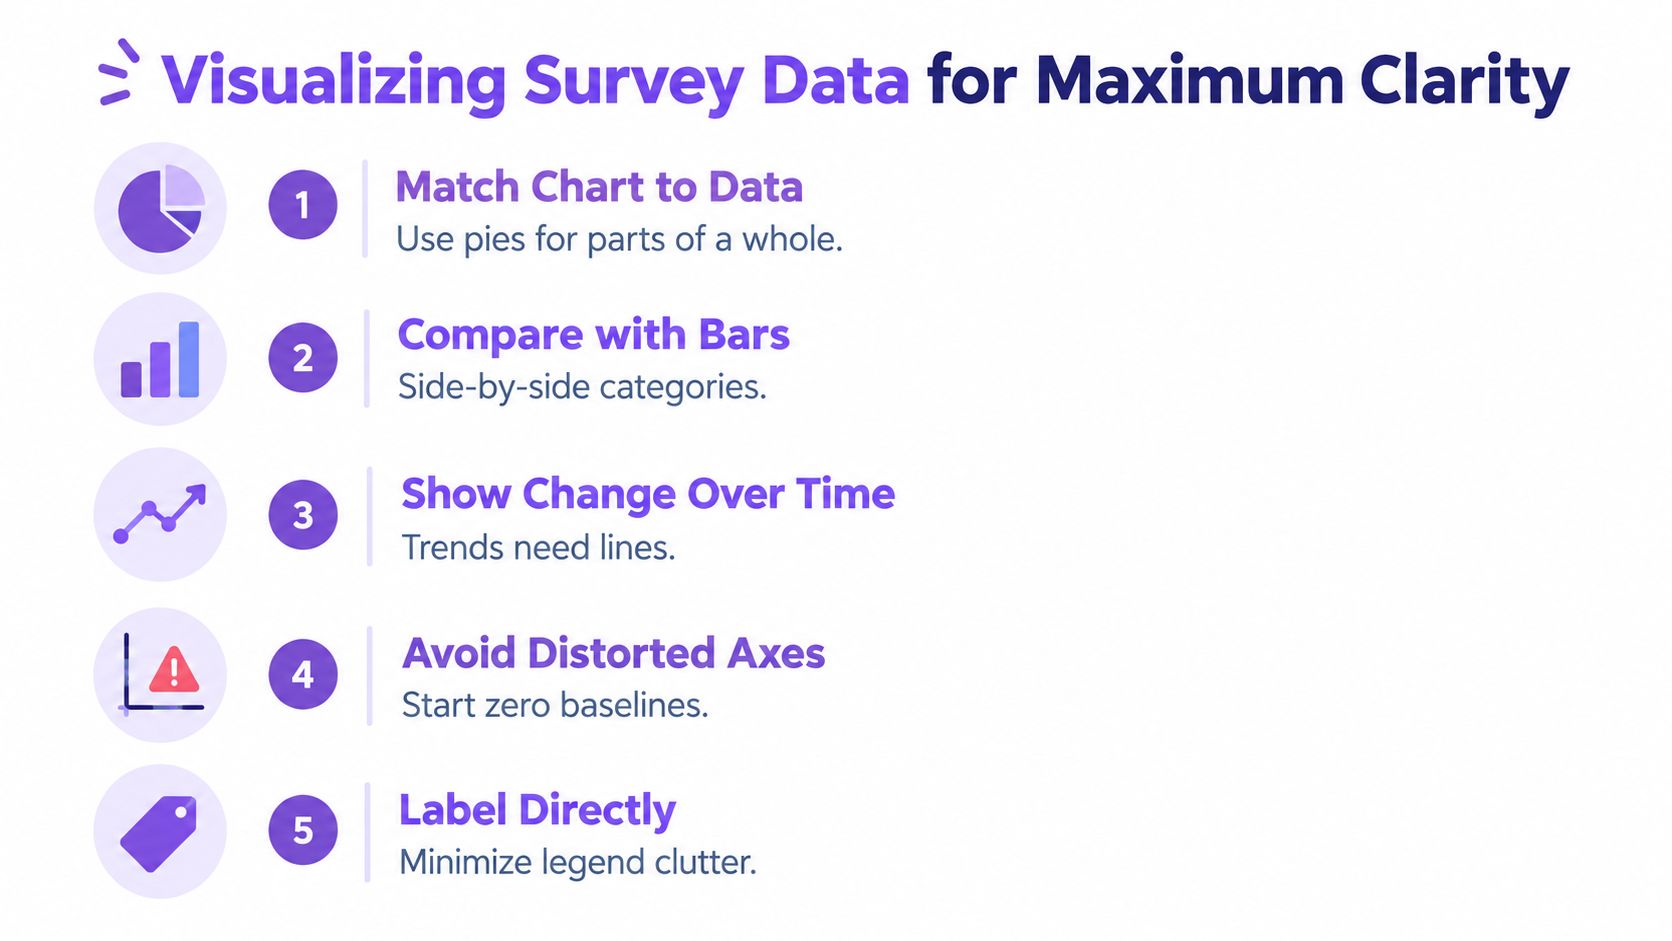
A chart should answer a question faster than a table, not decorate the page. Start by identifying the comparison the reader needs to make. Then choose the display that makes that comparison easiest.
A horizontal bar chart works well when respondents select among categories and the audience needs to compare magnitudes. It's usually clearer than a pie chart when categories have similar values or labels are long. A pie can work for a small number of parts that sum to a whole, but it makes precise comparisons difficult when slices are close in size.
Match the display to the response scale
Likert questions need more care than a single average. A diverging stacked bar can show the balance of positive, neutral, and negative responses while preserving the full distribution. An average score may be useful for tracking, but it can conceal polarized answers. Show the underlying response pattern when the disagreement itself matters.
For subgroup comparisons, align categories and scales across panels. Keep the same order, colors, and axis range. If every panel uses a different axis, small visual differences can look dramatic or disappear entirely.
Reduce interpretation work
Use direct labels where space allows. A reader shouldn't have to move between a crowded legend and several similarly colored segments. Reserve accent colors for the result that deserves attention, and use neutral tones for context.
- For rankings: Sort bars by value unless there's a meaningful fixed order.
- For trends: Use a line chart and label the fieldwork periods clearly.
- For distributions: Show all response categories when the shape matters.
- For open text: Display coded themes with an explanation of how responses were classified.
- For dashboards: Put the decision metric first, then provide filters and supporting detail.
A dashboard can offer exploration, but a static report still needs a stable narrative. Tools such as review analytics dashboards can help teams inspect sentiment or review patterns, but survey findings should remain visibly separate from review data unless the report explains how the sources were combined.
If a stakeholder needs a verbal explanation before understanding the chart, redesign the chart before expanding the commentary.
Interpreting Results and Avoiding Common Pitfalls
A larger sample doesn't automatically produce a better report. A poorly worded question can create systematic error across every response, while a convenient online panel can limit what the findings represent. More observations can reduce some forms of random uncertainty, but they don't repair biased recruitment or ambiguous measurement.
Question design is a common source of distortion. Leading wording, double-barreled questions, forced choices, dense matrix grids, and inconsistent recall periods can shape answers before analysis begins. Mode effects matter too. People may respond differently by web, phone, or panel mode because the interaction, privacy, pace, and perceived social pressure differ.
Treat non-probability samples honestly
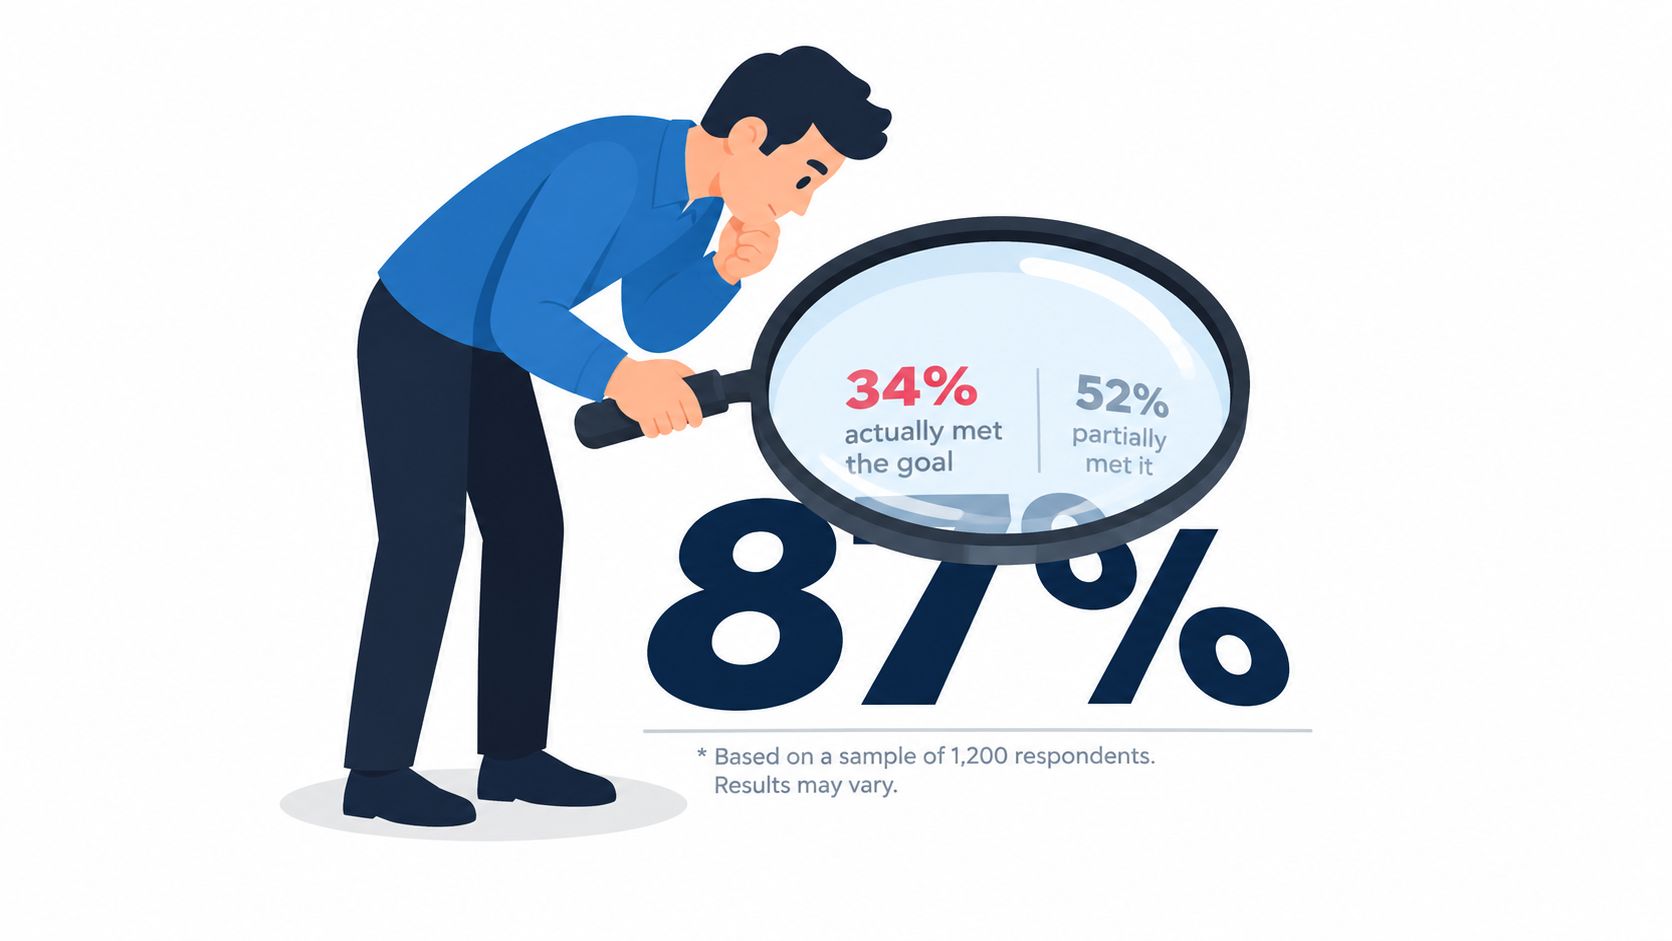
A conventional margin of error describes sampling uncertainty under assumptions associated with probability sampling. It can't be computed conventionally for a non-probability sample, such as some online panels or quota-based recruitment. The Reuters Institute's 2025 methodology notes also caution that some markets aren't nationally representative because they rely on online surveys, and that self-reported behavior may not match actual behavior.
That distinction belongs in the headline interpretation, not just the appendix. Write “among surveyed respondents” when that's the defensible scope. Don't write “customers believe” or “the market prefers” unless the design supports that generalization.
Recruitment attrition creates another problem. Pew's 2025 methodology pages describe address-based sampling, multimode fielding, and high survey-level response rates in their reporting, while also showing a cumulative response rate of only 3% after recruitment attrition in one study. That contrast matters. A strong response rate at one stage doesn't erase losses across the full recruitment process.
Test the instrument before trusting the output
Review the questionnaire with someone who wasn't involved in writing it. Ask what each question means, which assumptions it makes, and what a respondent should do when none of the offered answers fit. Pilot the routing and inspect completion patterns before launch.
StatCan's 2025 survey methodology review describes current work on anticipating nonsampling errors during design, using machine learning for editing and nonresponse adjustment, and combining administrative, sensor, satellite, and convenience data with probability samples. SurveyMonkey's 2025 platform trend report found that matrix question use declined 43% since 2015 while skip logic use almost doubled since 2019. Those figures should not be treated as universal quality benchmarks, but they reinforce a practical lesson: reduce respondent burden and use adaptive paths where they improve relevance.
A credible report names the weaknesses that could change the decision. That honesty doesn't weaken the work. It tells stakeholders how far they can safely take the findings.
Sharing Survey Reports With Different Audiences
One dataset can support several deliverables, but one document rarely serves every audience well. An internal product team needs traceability and detail. An external marketing audience needs a clear claim, appropriate context, and evidence that can withstand scrutiny.
Internal product teams need diagnostic depth
Product managers and researchers may need cross-tabs by plan, tenure, use case, or journey stage. They'll often want the questionnaire, coded variables, response-level data where permitted, and a record of exclusions. Their report should make it possible to ask, “Which group experienced this problem, and how confident are we that the difference is meaningful?”
Give this audience an analysis workspace or technical appendix. Include filters, base sizes, missing-data notes, and definitions for derived measures. A workshop can then focus on prioritization instead of arguing about what a column means.
External audiences need a defensible story
Marketing content should extract a narrow narrative from the full study. Select a finding that matters to the audience, explain the respondent group, state the fieldwork context, and avoid implying broader representativeness than the design permits. A polished chart or landing-page statistic still needs a source note.
The trade-off is between accessibility and completeness. Removing every technical detail makes the claim vulnerable. Publishing every cross-tab makes the asset unreadable. Use layered communication:
- Executive brief: One page with the objective, key findings, limitations, and decisions.
- Working report: Full narrative, charts, methodology, and recommendations.
- Technical appendix: Questionnaire, coding, weighting, exclusions, and supplementary tables.
- Activation assets: Short charts, presentation slides, or web copy with a concise methodology note.
Give each audience a controlled version
Keep one canonical dataset and analysis log. Derive audience-specific outputs from that source rather than allowing teams to copy figures into separate spreadsheets. Every external asset should point back to the approved report version and carry the same definitions.
For customer-facing content, avoid turning a survey response into a testimonial unless the respondent explicitly provided permission for that use. Survey evidence and customer reviews answer different questions. Combining them can be useful, but the report should label the sources separately.
Turning Survey Insights Into Actionable Strategy
A survey report earns its place when someone changes a decision because of it. The final pages should therefore connect each important finding to an owner, an action, a rationale, and a way to assess progress.
Start with a post-report workshop. Bring together the research owner, the team responsible for the customer or employee experience, and the person who can approve resources. Review the findings in order of business impact, then separate three categories:
- Act now: The evidence is sufficiently clear, and the proposed change is reversible or low risk.
- Investigate next: The pattern matters, but uncertainty or subgroup differences require follow-up research.
- Monitor: The result provides useful context but doesn't justify immediate intervention.
Prioritize recommendations using both statistical evidence and practical consequence. A small but consistent problem in a critical journey may deserve more attention than a larger difference in a low-impact area. Conversely, a dramatic subgroup result with a small denominator may need validation before the team commits to a major change.
Create a measurement cadence
Define what will be tracked, who owns it, and when the team will review it. Use the same question wording and population definition when trend comparison is important. If the method changes, mark the break clearly instead of presenting the series as uninterrupted.
Before publication, run a final checklist:
- Scope: Does the report state what the sample represents?
- Method: Can another analyst understand recruitment, fieldwork, exclusions, and questionnaire design?
- Participation: Are invitations, completions, incomplete responses, and response-rate calculations visible?
- Uncertainty: Are weighting, design effects, margins of error, or non-probability limitations explained?
- Visuals: Do charts preserve the distribution and make the intended comparison clear?
- Action: Does every recommendation identify a decision, owner, or follow-up?
- Governance: Do the published figures match the approved dataset and report version?
A disciplined report doesn't promise certainty. It gives stakeholders enough context to act proportionately, learn from the outcome, and improve the next measurement cycle.
Bragly helps teams collect, manage, analyze, and display customer reviews and testimonials from multiple sources, with no-code widgets and review analytics that can complement structured survey findings. Visit Bragly to see how you can organize customer evidence and publish it alongside clearer, more accountable reports.